Overview
This project addresses several key business questions related to pet insurance policies, claims, and policy lapses. The primary goal is to analyse datasets to provide insights and develop predictive models that can enhance the understanding and management of pet insurance policies and claims. The project is divided into multiple phases: data preprocessing, data analysis to get insight from the data, and predictive modelling to predict whether a policy will lapse in the year or not.
Data Preprocessing
Data Analysis
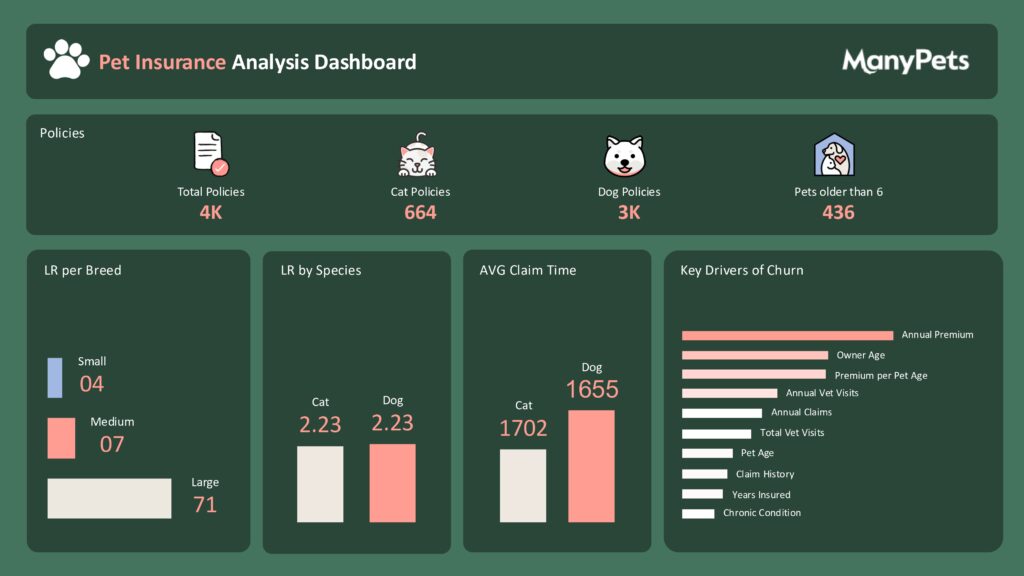
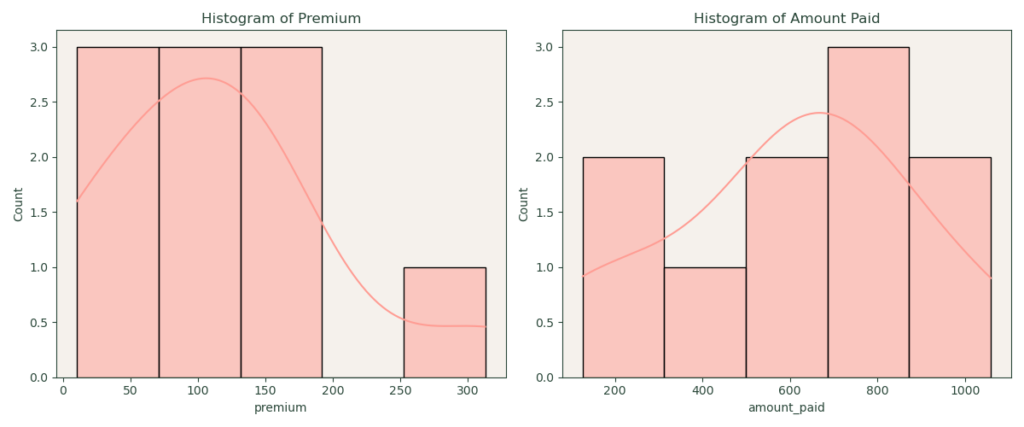
In this phase, we analyze the cleaned datasets to answer specific business questions related to pet insurance policies and claims. Firstly, we determine the number of policies in the dataset, including how many are for cats and how many were purchased for pets older than 6 years. Secondly, we calculate the average loss ratio per species and breed, defining the loss ratio as the amount paid in claims divided by the amount collected in premiums. Thirdly, we measure the average time to make a claim for both cats and dogs, and assess whether these times are significantly different. This analysis provides valuable insights into the characteristics and behaviors of different policyholders and their pets.
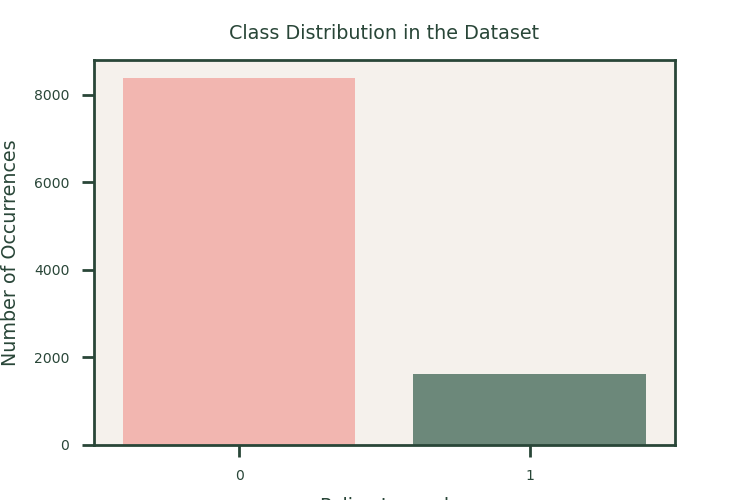
Class Balancing
In this case study, addressing class imbalance was crucial to developing effective predictive models. We initially employed class weighting techniques, where each class is assigned a weight inversely proportional to its frequency in the dataset. This approach ensures that the model gives more importance to the minority class (policies that lapse), thereby improving its ability to correctly identify these instances.
We also experimented with undersampling, which involves reducing the number of instances in the majority class (policies that do not lapse) to match the minority class. This method provides a simpler approach to balance the classes but can result in the loss of valuable information due to the reduction in the majority class instances.
We opted not to use oversampling techniques like SMOTE (Synthetic Minority Over-sampling Technique), or hybrid techniques such as SMOTEEN, or SMOTETomek for this case study. These methods generate synthetic samples for the minority class to balance the dataset. While effective in many scenarios, they can introduce noise and overfitting, particularly when the dataset is not complex or high-dimensional, as with our insurance churn data. By using class weighting and undersampling, we maintained the integrity of the original dataset while addressing the class imbalance effectively.
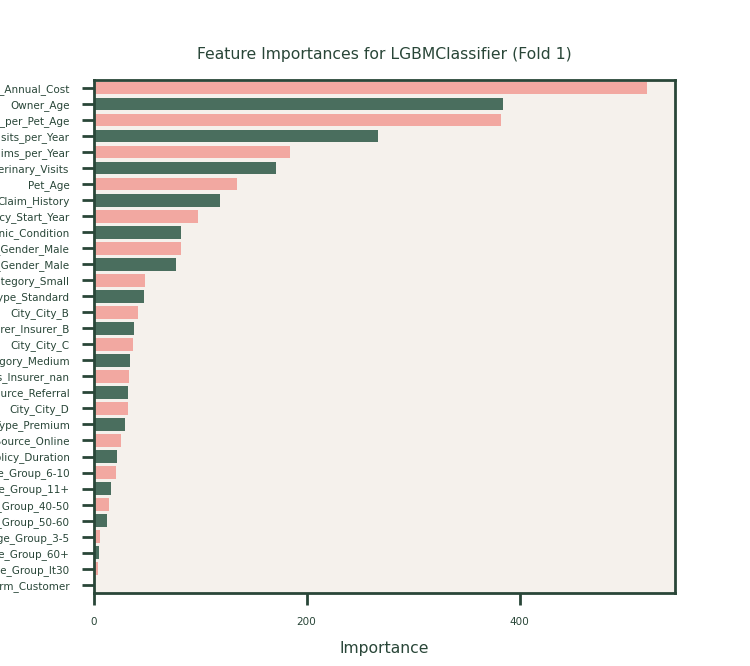
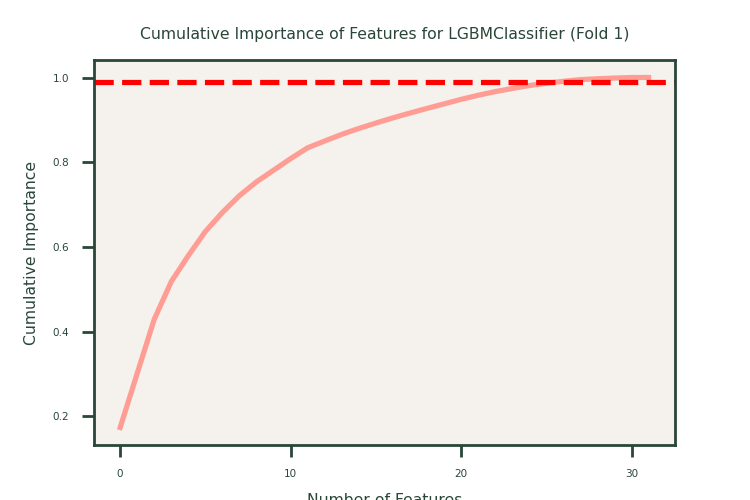
Feature Selection
Data Modeling
In this phase, we focus on developing predictive models to address the problem of policy lapses. Using the churn dataset, we train models to predict whether a policy will lapse within a year. To handle class imbalance, we apply techniques such as class weighting and undersampling. We experiment with various machine learning algorithms to develop these models, including logistic regression, decision trees, random forests, and gradient boosting machines.
Logistic Regression
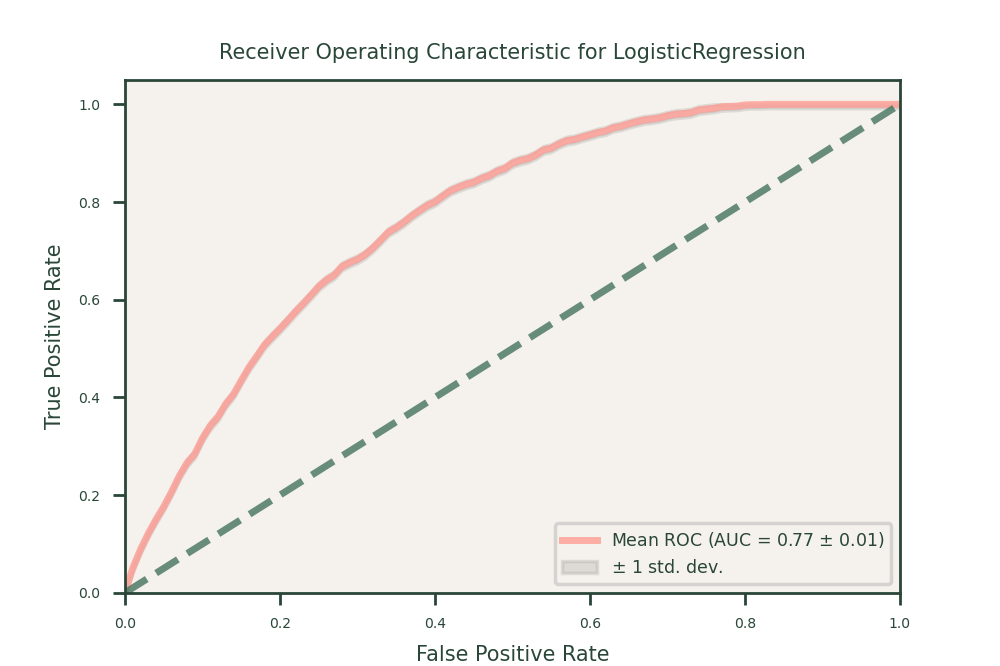
We used logistic regression as the base model, Logistic regression is a simple yet effective algorithm for binary classification problems. It provides clear insights into the relationship between the features and the target variable, making it easier to interpret the influence of different factors on policy lapses

Random Forests
XGBoost
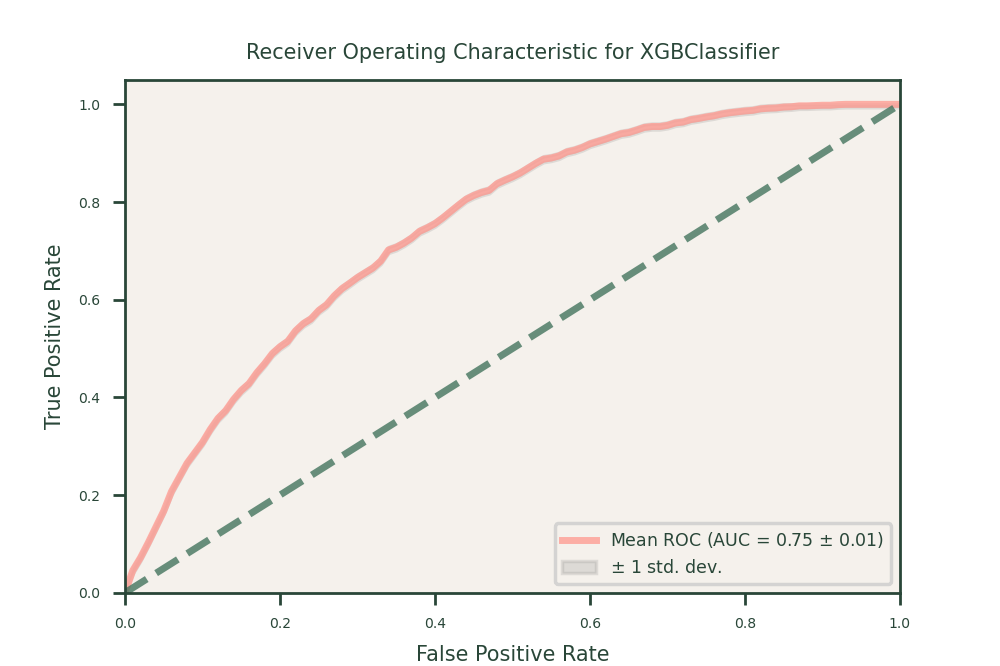
We used XGBoost because it is great at finding complex patterns in data. For our insurance datasets, XGBoost improved accuracy by focusing on correcting errors from previous models. This helped us capture important details about policy lapses, resulting in high balanced accuracy, recall, and ROC-AUC scores. XGBoost was particularly good at spotting subtle trends that simpler models might miss.

LightGBM
LightGBM was chosen for its speed and ability to handle large datasets efficiently. It uses a unique method to quickly process data, which was ideal for our insurance data. LightGBM also improves accuracy by fixing previous errors, similar to XGBoost. It performed well in our case study, achieving high balanced accuracy, recall, and ROC-AUC scores. LightGBM was especially effective at handling categorical features and missing values, making it a valuable tool for our predictions.
By employing these models, we ensure a comprehensive approach to predicting policy lapses. Each model offers unique strengths: logistic regression for interpretability, random forests for robustness and feature importance, and gradient boosting machines for capturing complex patterns. This diversity in modeling techniques enhances our ability to make accurate and actionable predictions, ultimately leading to better management and retention of pet insurance policies.
Performance Metrics
To evaluate the effectiveness of our predictive models in identifying policy lapses, we utilized several key performance metrics that provide a comprehensive understanding of model accuracy and robustness. The metrics used are:
Balanced Accuracy:
- Reason: Balanced accuracy adjusts for class imbalance by averaging the recall obtained on each class. This metric provides a more accurate measure of model performance in datasets where the classes are not equally represented.
Recall:
- Reason: Recall (sensitivity) measures the proportion of true positive predictions among all actual positive instances. It indicates the model’s ability to correctly identify all positive instances (e.g., policies that will lapse), which is crucial in scenarios where missing a positive instance can be costly.
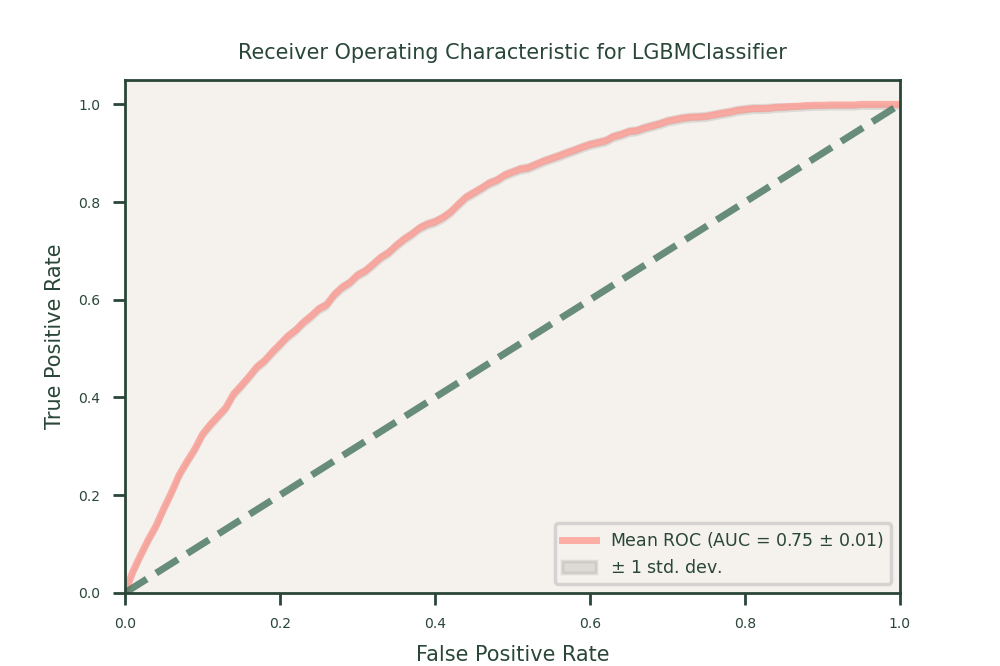
ROC-AUC Score:
- Reason: The Receiver Operating Characteristic – Area Under Curve (ROC-AUC) score measures the model’s ability to distinguish between classes. It provides an aggregate measure of performance across all classification thresholds, making it a robust metric for evaluating the discriminative power of the model.
Model Comparison and Performance
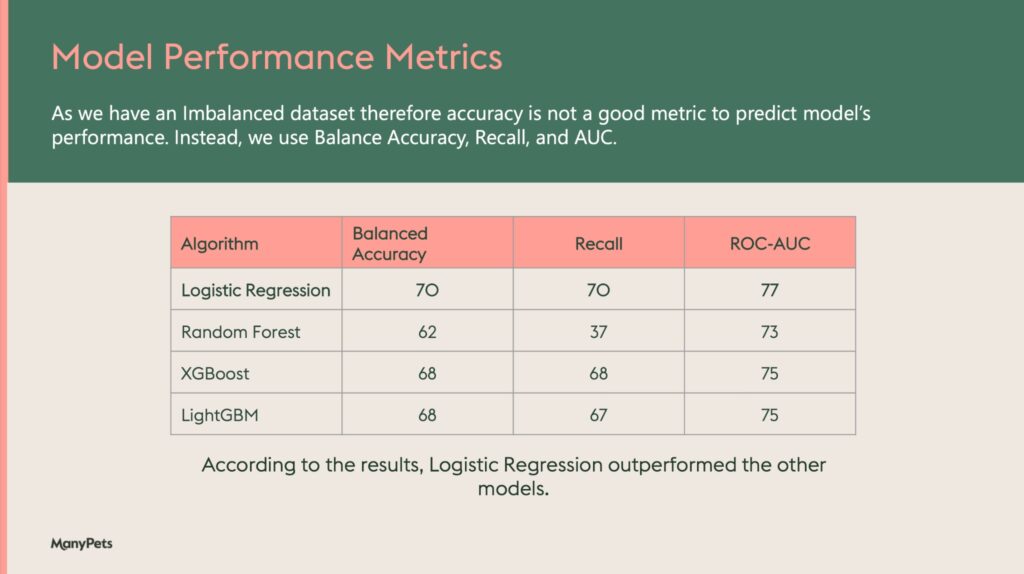
Upon evaluating the models using these metrics, we observed the following results:
Logistic Regression:
- Performance: Logistic regression provided a balanced accuracy of 70, a recall of 70, and a ROC-AUC of 70. This model served as a solid baseline with good interpretability but struggled with capturing complex patterns in the data.
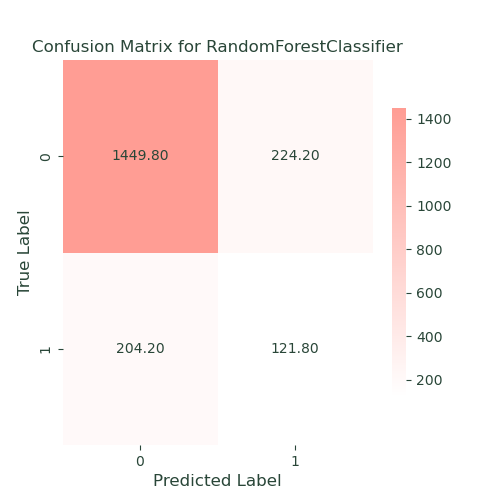
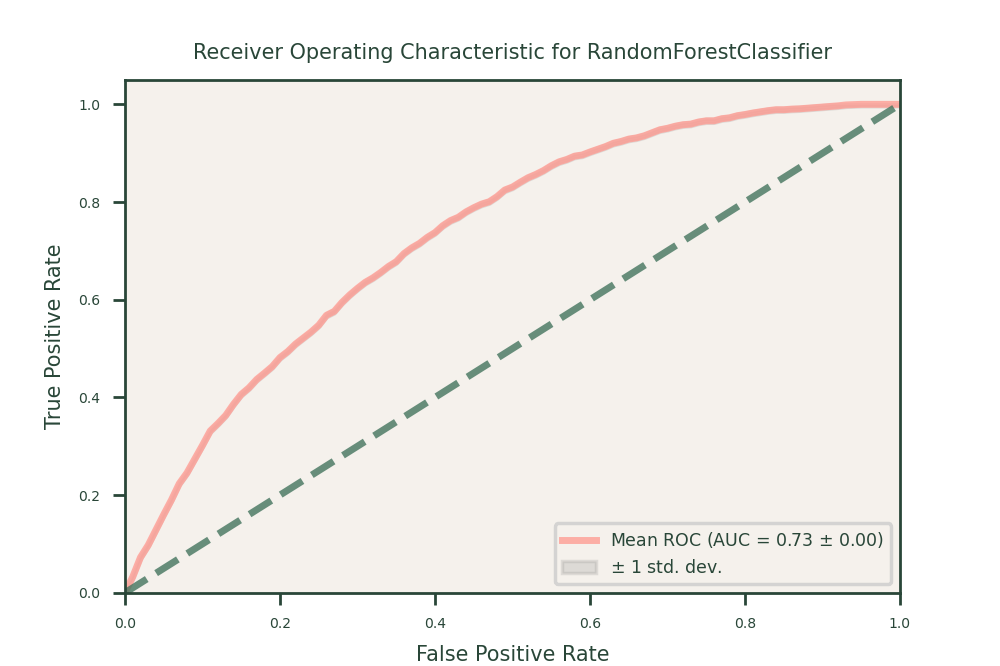
Random Forests:
- Performance: Random forests showed a balanced accuracy of 62, a recall of 37, and a ROC-AUC of 73. While this model improved the robustness and accuracy over single decision trees, it underperformed in recall, indicating difficulties in identifying all positive instances.
XGBoost:
- Performance: XGBoost achieved a balanced accuracy of 68, a recall of 68, and a ROC-AUC of 75. This model demonstrated strong performance across all metrics, effectively capturing complex patterns and subtle interactions in the data.
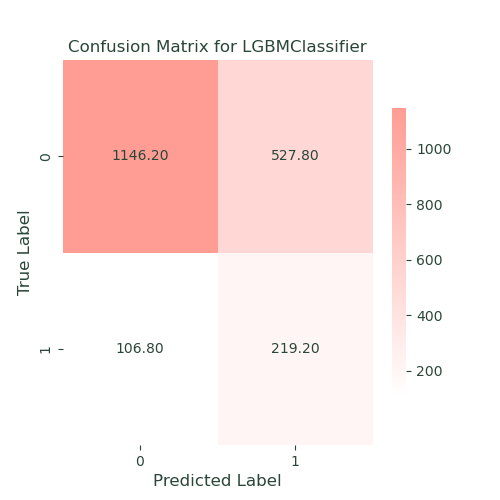
LightGBM:
- Performance: LightGBM achieved a balanced accuracy of 68, a recall of 67, and a ROC-AUC of 75. This model, similar to XGBoost, provided robust performance and was effective in identifying policy lapses, making it one of the top-performing models.
Conclusion on Performance Metrics
Using these performance metrics, we comprehensively evaluated and compared the predictive power and reliability of each model. Logistic regression served as a reliable baseline with balanced performance across all metrics. Random forests, while robust, struggled with recall. XGBoost and LightGBM emerged as the top-performing models, offering high balanced accuracy, recall, and ROC-AUC scores. These models were most effective in predicting policy lapses in our dataset, providing robust and actionable predictions.