Overview
In the “Road Accident Analysis” project, I conducted a detailed exploration of road accident data, focusing on various metrics and visualizations using Tableau. The project aimed to provide insights into the frequency, severity, and contributing factors of road accidents to aid in understanding and improving road safety measures.
Key Insights and Visualizations
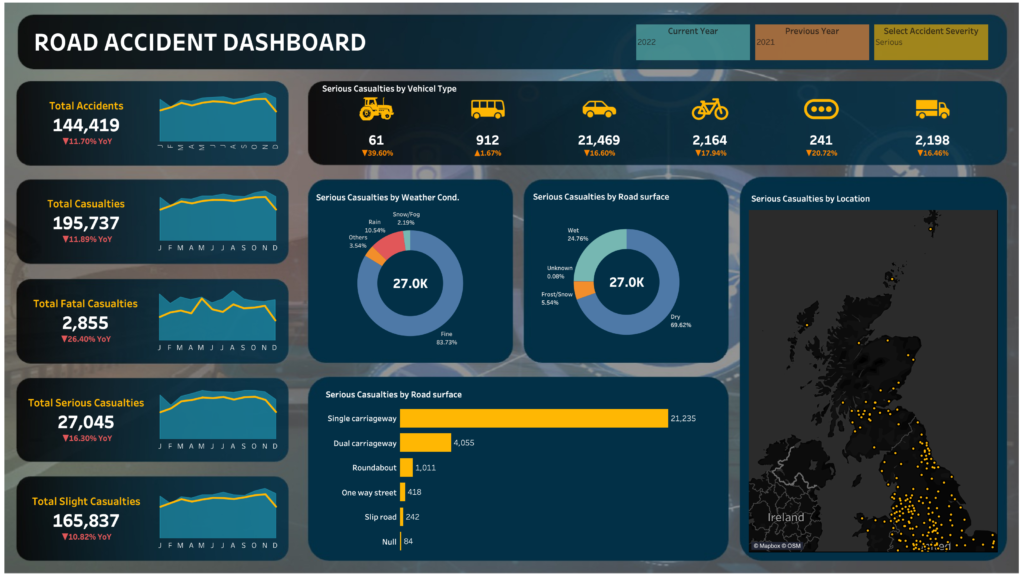
Total Accidents and Casualties:
- Analyzed the total number of accidents and casualties over a specific period, highlighting trends and variations.
Fatalities and Severity:
- Investigated the number of fatal, serious, and slight casualties to understand the impact of accidents more deeply.
Severity by Vehicle Type:
- Examined how different vehicle types contribute to serious casualties, identifying potentially high-risk vehicle categories.
Severity by Weather Conditions:
- Explored the relationship between weather conditions (such as rain, snow, fog) and serious casualties to assess weather-related risks.
Severity by Road Surface:
- Investigated the influence of road surface conditions (like wet, icy, dry) on the severity of accidents, aiding in infrastructure and maintenance decisions.
Severity by Location:
- Mapped the distribution of serious casualties across different geographical locations to identify hotspots and patterns.
Industry Use Cases and Applications
Transportation and Infrastructure Planning:
- Decision Support: Government agencies can use insights to prioritize road maintenance and infrastructure improvements based on accident severity linked to road conditions.
- Policy Making: Inform policies regarding speed limits, road signage, and traffic management strategies to reduce accidents.
Insurance and Risk Assessment:
- Risk Profiling: Insurance companies can utilize data on accident severity by vehicle type and location to adjust premiums and assess risk profiles for drivers and vehicles.
- Claims Management: Enhance claims management processes by understanding the circumstances and severity of accidents.
Public Safety and Awareness:
- Education Campaigns: Public authorities can design targeted awareness campaigns addressing common factors contributing to serious accidents (e.g., weather impact, road surface conditions).
- Emergency Response Planning: Improve emergency response protocols by identifying high-risk areas and conditions prone to serious accidents.
Urban Planning and Development:
- City Planning: City planners can integrate insights into road accident data into urban development plans to create safer transportation networks.
- Infrastructure Design: Incorporate findings into the design of new roads, intersections, and pedestrian crossings to enhance safety measures.
Conclusion
The “Road Accident Analysis” project using Tableau has provided valuable insights into the dynamics of road accidents, emphasizing factors that contribute to serious casualties. By leveraging this analysis, stakeholders across various sectors can make informed decisions aimed at improving road safety, reducing accidents, and mitigating their impact on individuals and communities. This project not only contributes to data-driven decision-making but also underscores the importance of proactive measures in enhancing public safety and transportation efficiency.