Project Overview
I undertook the project titled “Data Visualization of Craigslist Used Cars for Market Analysis” to develop an interactive dashboard aimed at analyzing the used car market in New York and its neighboring states. The primary objective was to identify price differences and factors affecting the reliability and maintenance costs of used cars, tailored specifically for Sarah, a master’s student seeking a budget-friendly and reliable car.
Methodology
The project began with data acquisition, which originally contained 26 variables. The data underwent a rigorous cleaning process using R Studio to remove inconsistencies, missing values, and outliers. This process reduced the dataset to the nine most relevant variables, ensuring accuracy and reliability for subsequent analysis. Key variables included price, manufacturer, model, year, condition, and mileage, among others.
Implementation
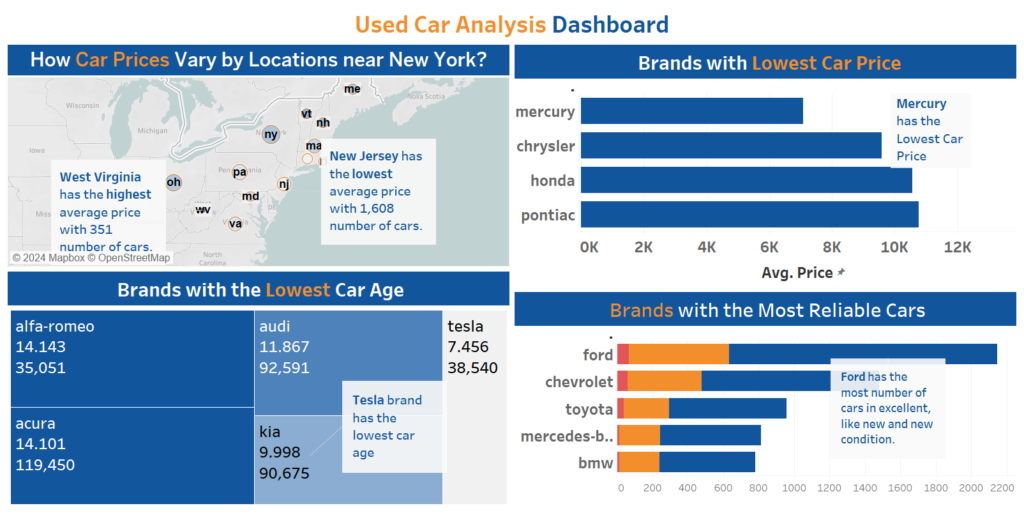
For the visualization component, Tableau was employed to create a comprehensive dashboard. The final dashboard comprised several key visualizations:
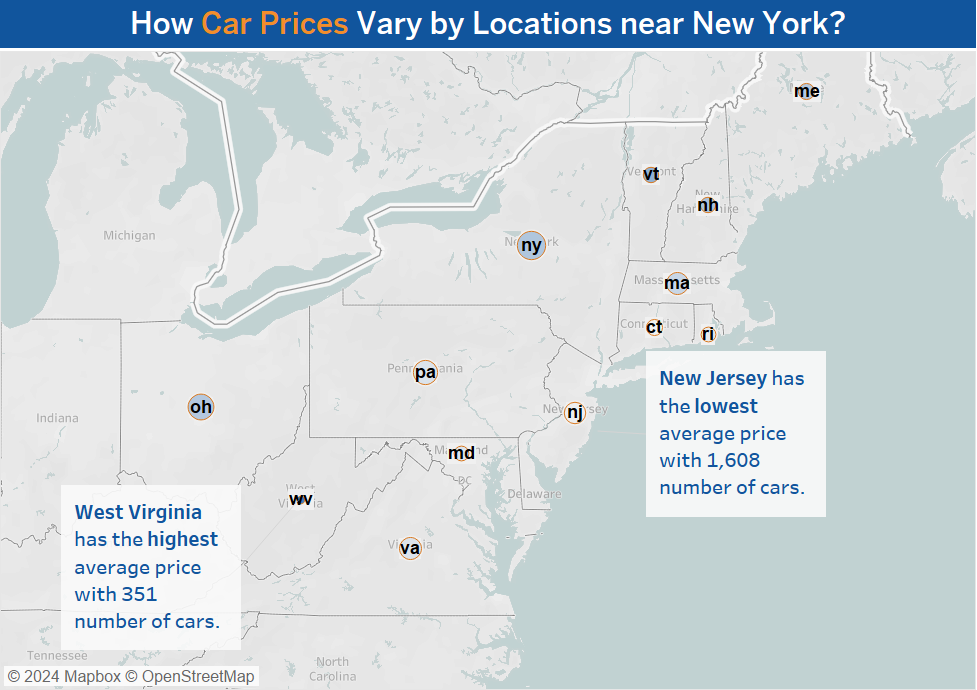
- Map Visualization: This map displays the distribution and average prices of used cars across various states, with color coding indicating price levels and circle size representing the number of cars available.
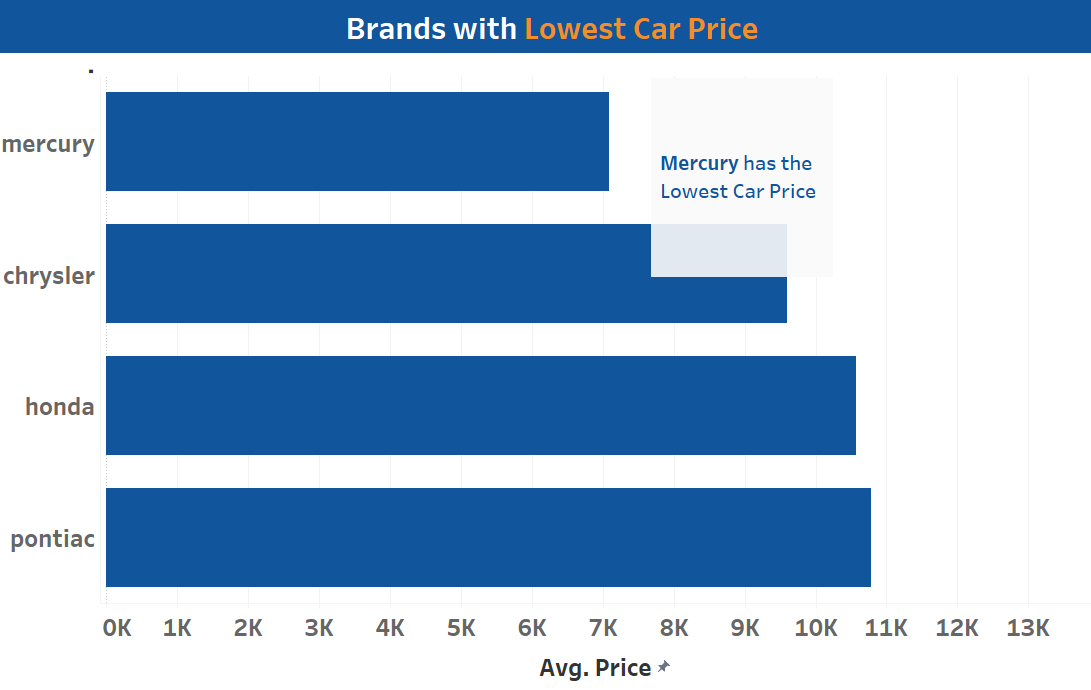
- Bar Chart: This chart compares average car prices by manufacturer in New York and neighboring states, allowing users to filter data by variables such as condition and car age.
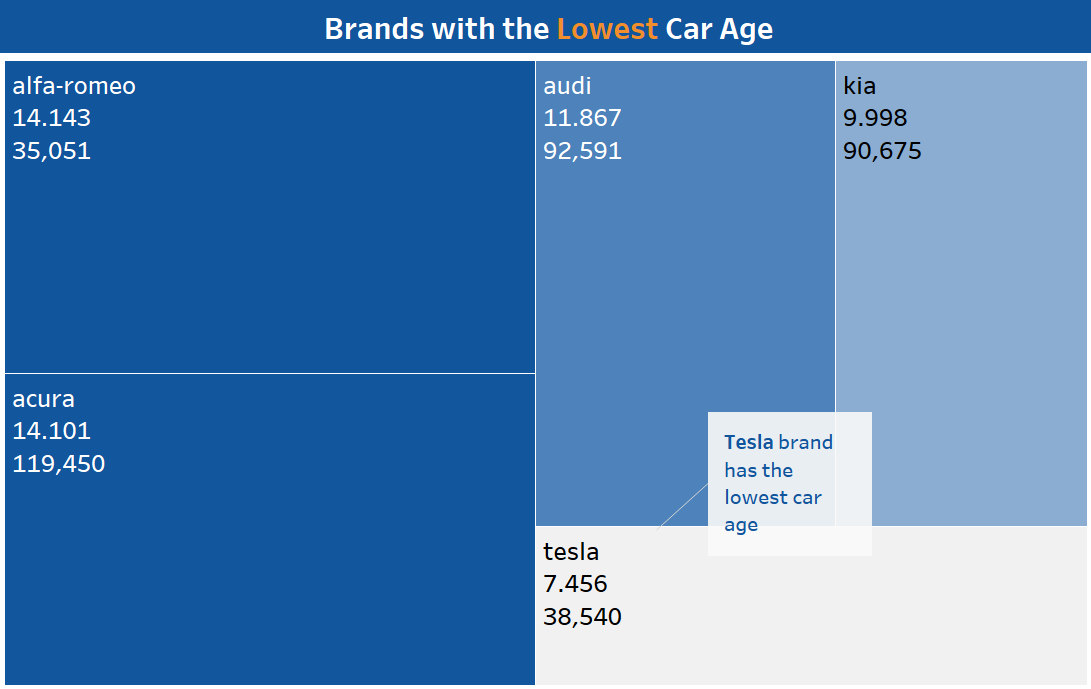
- Tree Map: This visualization depicts car manufacturers and their corresponding car ages and mileages, color-coded to highlight lower-mileage and younger cars.
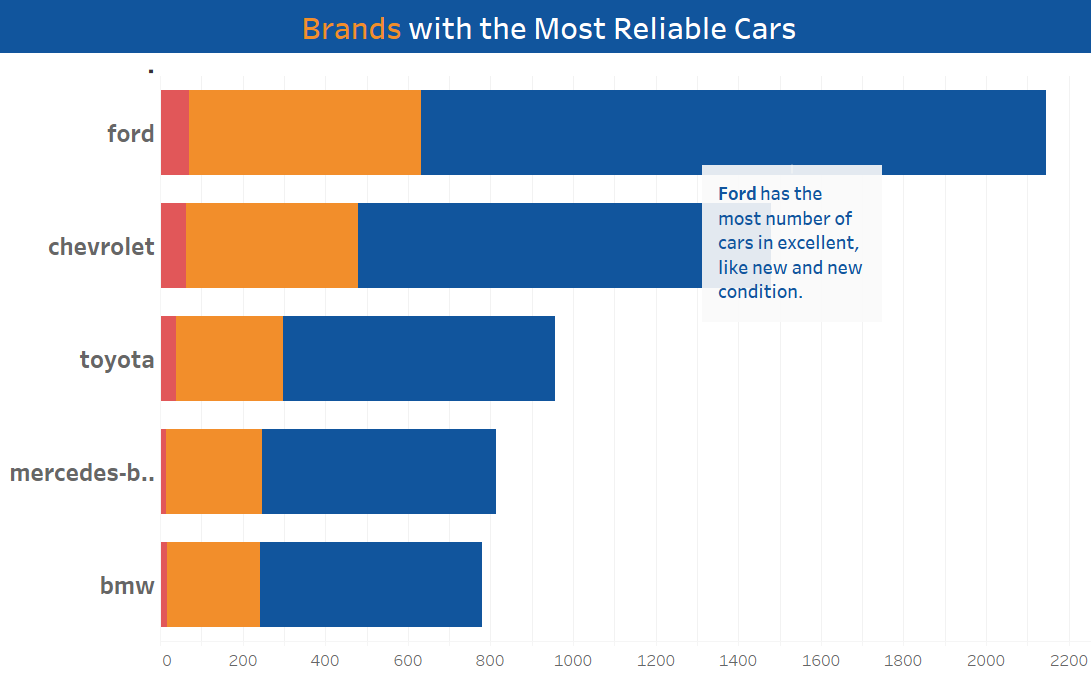
- Stacked Bar Chart: This chart illustrates the number of cars in different conditions (e.g., excellent, good, fair) for each manufacturer, indicating brands with the highest number of well-maintained cars.
Interactive filters were added to the dashboard to enable users to dynamically explore the data based on specific criteria, enhancing the utility and user experience of the analysis.
Result and Insights
The final dashboard provided comprehensive insights into the used car market in New York and its neighboring states. By visualizing the average car prices geographically and by manufacturer, it was revealed that New Jersey had the lowest average prices, while West Virginia had the highest. Additionally, the dashboard highlighted that brands like Mercury, Chrysler, Honda, and Pontiac offered the lowest-priced cars in the region. The tree map visualization identified Kia, Acura, and Audi as manufacturers with the lowest average car ages, suggesting potentially lower maintenance costs. The stacked bar chart further indicated that brands such as Ford, Chevrolet, Toyota, Mercedes-Benz, and BMW had the highest number of cars in excellent condition, implying higher reliability. Interactive filters allowed users to dynamically explore these insights, providing a powerful tool for making informed decisions about purchasing used cars. Overall, the dashboard successfully answered the research questions, offering a clear and interactive analysis of the used car market.